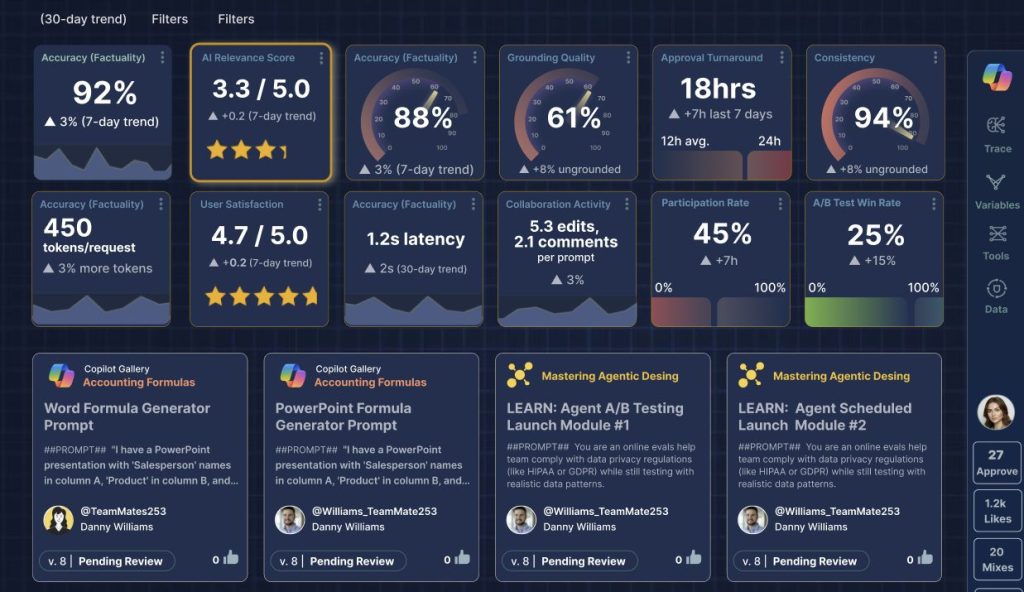
I recently spent months in discovery identifying the most meaningful AI prompt evaluation metrics for our work. There are lots of numbers to crunch, but which ones really matter at the uppermost levels of oversight, and where can we find detailed indicators for next steps in the AI lifecycle management system. Adoption was paramount and ease of use for complex tasking was essential for adoption. Relying on AI guidance was helpful for lists of metrics but proved insufficient in prioritizing them based on real usefulness – often completely missing the point of the number; as we know, AI struggles with user-centric thinking. It often suggested metrics that had value but for different reasons: numbers that justify themselves simply by existing.
Many practitioners dismiss these analytics as “vanity metrics” – data points that look impressive but offer no actionable insights for decision-making, next steps or strategic planning. For administrators overseeing a collaborative prompt management system, where users submit, review, collaborate and iterate on prompts, tracking performance, quality outputs and operational adoption is critical. The enterprises often spend millions implementing these new tools in hopes of big returns, but that is reliant on adoption and actual usage – tracking this is essential.
Two things have changed since the first version of this list. First, prompts no longer live alone: they drive multi-step agentic workflows, and a portal that only measures single-turn output is measuring the wrong layer. Second, the shift to token-based billing moved cost from a footnote to a governance concern. The list below reflects both.
Below are 12 essential metrics, ranked from most to least important (ranked by real-world usefulness and adoption impact, reflecting the most desired and actionable priorities for AI lifecycle management), to ensure governance, reliability, and continuous improvement in prompt quality.
1. Accuracy (Factuality) Measures how factually correct the model’s output is compared to ground truth or verified sources. This is the cornerstone metric for production-grade prompts, especially in domains like healthcare, finance, or legal support. Evaluated using human review, LLM-as-judge, or comparison with reference datasets. Without factual accuracy, every downstream metric becomes meaningless – this is the non-negotiable foundation of trust and compliance.
2. Relevance Assesses whether the generated response aligns with the user’s intent and stays on-topic. High relevance ensures the prompt guides the model effectively toward desired outcomes. Measured primarily via LLM-as-judge against a scoring rubric, with human calibration on a sample; embedding similarity still has a place as a cheap first-pass filter, but it should no longer be the metric of record. A technically accurate response that misses the user’s intent is still a failed prompt.
3. Grounding Quality Evaluates how well the prompt leverages and cites correct data from connected knowledge sources (e.g., Salesforce objects, vector databases). Poor grounding leads to hallucinations. Key in RAG (Retrieval-Augmented Generation) systems, tracked via citation accuracy and source fidelity. As enterprise AI increasingly relies on live data connections, grounding quality is what separates a reliable system from a confident one that is wrong.
4. Task Completion Rate (Agentic Workflows) Measures whether multi-step, tool-using workflows driven by portal prompts actually finish the job: task completed, correct tools called, acceptable number of steps. Tracked via trajectory logging – tool-call accuracy, steps-to-completion, and end-state verification. Single-turn metrics can all look healthy while the agent wanders, loops, or stalls; this is the metric that measures the system the way the user experiences it. A prompt that produces beautiful sentences and abandoned tasks is a liability with good grammar.
5. Safety and Guardrail Compliance Tracks policy-violation rate, jailbreak resistance, and data-leakage incidents (PII, credentials, confidential sources) across portal outputs. Evaluated through red-team suites run on every prompt version and automated policy classifiers in production. This is the metric your legal and compliance teams believe you are already tracking – governance that does not measure its own guardrails is a promise, not a system.
6. User Satisfaction Score (USS) Collects direct feedback from end-users interacting with AI outputs (e.g., thumbs up/down, star ratings, surveys). Reflects real-world usability and perceived value; enables closed-loop improvement cycles. This is the human signal that validates or challenges everything the technical metrics tell you – it is where adoption is won or lost.
7. Consistency Measures output stability when the same prompt is run multiple times or across different environments. High variance indicates poor prompt design or model sensitivity; evaluated via output similarity metrics over repeated trials. In enterprise settings, inconsistency erodes trust rapidly. Users who cannot predict how a prompt will behave will stop using the system.
8. Model Drift Delta Measures output change when the same approved prompt runs against a new model version. Providers ship model updates on their schedule, not yours; a prompt that passed evaluation in March can silently degrade in June with no one touching it. Tracked by re-running the evaluation suite against every model version change and diffing scores. Rollback frequency catches this failure late and in production – drift monitoring catches it in staging, which is the difference between maintenance and incident response.
9. Approval Turnaround Time Tracks the average time taken for a submitted prompt to move from draft to review to approval. Indicates workflow efficiency and team responsiveness; helps identify bottlenecks in governance processes. Slow approval cycles are one of the most common silent killers of prompt portal adoption – if contributors wait too long for feedback, they disengage.
10. Cost per Resolved Task Monitors what an outcome actually costs, not just what a response costs: total tokens, tool calls, and retries divided by tasks successfully completed. Raw token counting was sufficient when inference was subsidized; under token-based billing it is table stakes, and the number that matters is the cost of getting the job done. A prompt that works but burns three times the tokens of an equivalent is not a production-ready prompt – and an agent that resolves tasks in four steps instead of eleven is a budget line, not a nicety.
11. Evaluation Pass Rate and Revision Count Percentage of prompts that pass evaluation criteria on first submission, paired with the number of iterations a prompt undergoes before approval. Low pass rates and high revision counts point to the same root causes: unclear guidelines, weak tooling, or gaps in training. Broken down by team, domain, or prompt type, and tracked over time, these two numbers together are a direct indicator of the health of your prompt engineering culture – and whether your governance process is maturing or stagnating.
12. Rollback Frequency Counts how often a deployed prompt is reverted due to poor performance or errors. High rollback rates signal weak pre-deployment testing or insufficient evaluation; a lagging indicator of overall prompt governance maturity. While it sits last on this list, a rising rollback rate should trigger an immediate review of your evaluation pipeline – and, since the drift metric above exists, a rising rollback rate now means your staging checks are being skipped, not that surprises are inevitable.