| Client: Ware2Go (UPS) Timeline: Oct. 2020 – May 2021 Role: Lead Product Designer – UX research, interaction design, prototyping, validation Team: Product Manager, Warehouse Ops SMEs, Frontend Engineers, Data/Platform Tools: Figma, design system libraries, rapid prototyping frameworks, analytics |
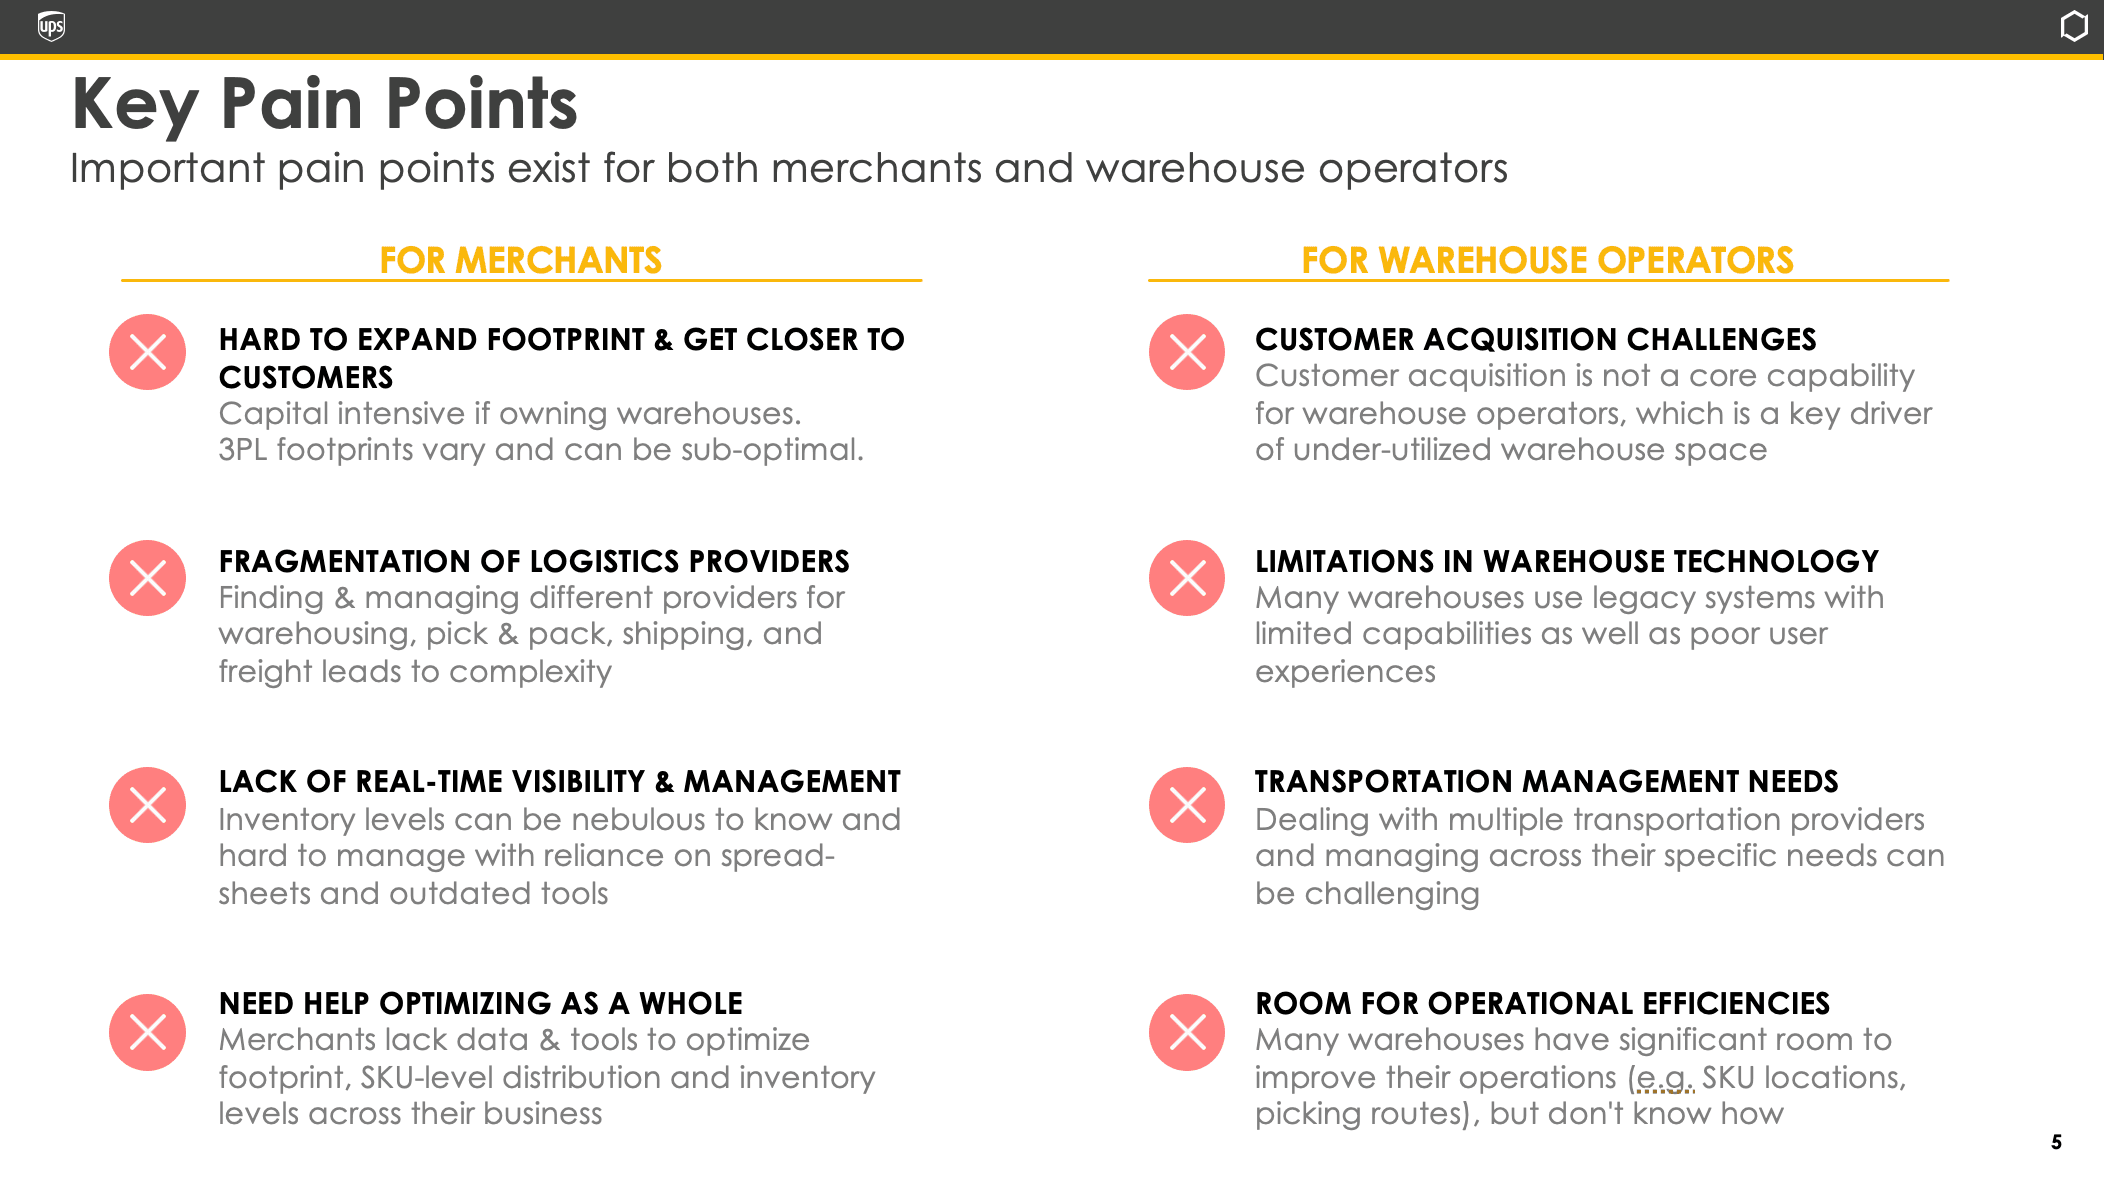
Project SummaryAs Lead Product Designer, I shaped the vision, drove research, and connected design decisions to business outcomes. By balancing operator needs with executive concerns, I turned a skeptical stakeholder group into advocates and delivered a product that scaled across Ware2Go’s enterprise clients. I led user research and iterative prototyping with warehouse operators. Early testing surfaced a key tension: the redesigned multi-step workflow reduced clutter but felt slower due to added clicks. Operators told us: “I get the logic, but I feel like I’m clicking more than before.” Instead of reverting, I introduced inline shortcuts and predictive defaults to cut redundant actions. This turned skepticism into enthusiasm, showing operators that the design wasn’t just cleaner, it was faster. To reduce multitasking anxiety, I repurposed a familiar pattern: horizontal tabs. Borrowed from browser design, tabs let operators keep multiple orders open at once, compare them visually, and switch context instantly. Familiarity reduced cognitive load and improved confidence for new hires. While my role concluded before broader adoption, the tabbed navigation model and tiered dashboards I introduced became a reusable design approach for other operational tools in Ware2Go’s ecosystem. Just as importantly, I validated design impact in business terms, demonstrating that efficiency gains translated into ~12 hours saved per operator per month—a story product leadership could carry forward as part of the SaaS value proposition.” | ProblemWarehouse operators were struggling with outdated, complex forms to track produce across the supply chain. The UI created cognitive overload, slowed down data entry, and made onboarding new staff painful. Operators wasted time correcting mistakes, while leadership faced rising operational costs. Yet there was a deeper challenge: stakeholders resisted change. The old system was clunky but familiar, and adoption would only happen if the redesign clearly proved its value. Design ChallengeI needed to reduce friction for operators while earning stakeholder buy-in. This meant tackling three layers of the problem:
|
 |  |
Solutions
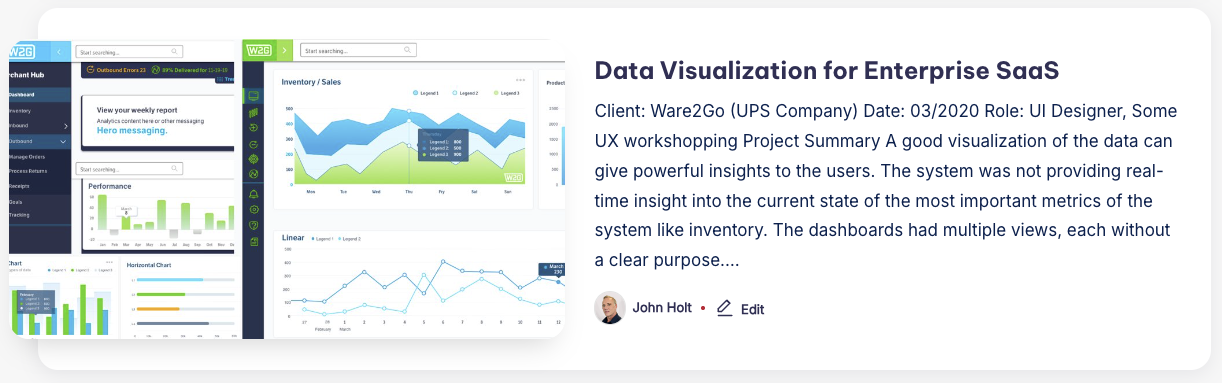
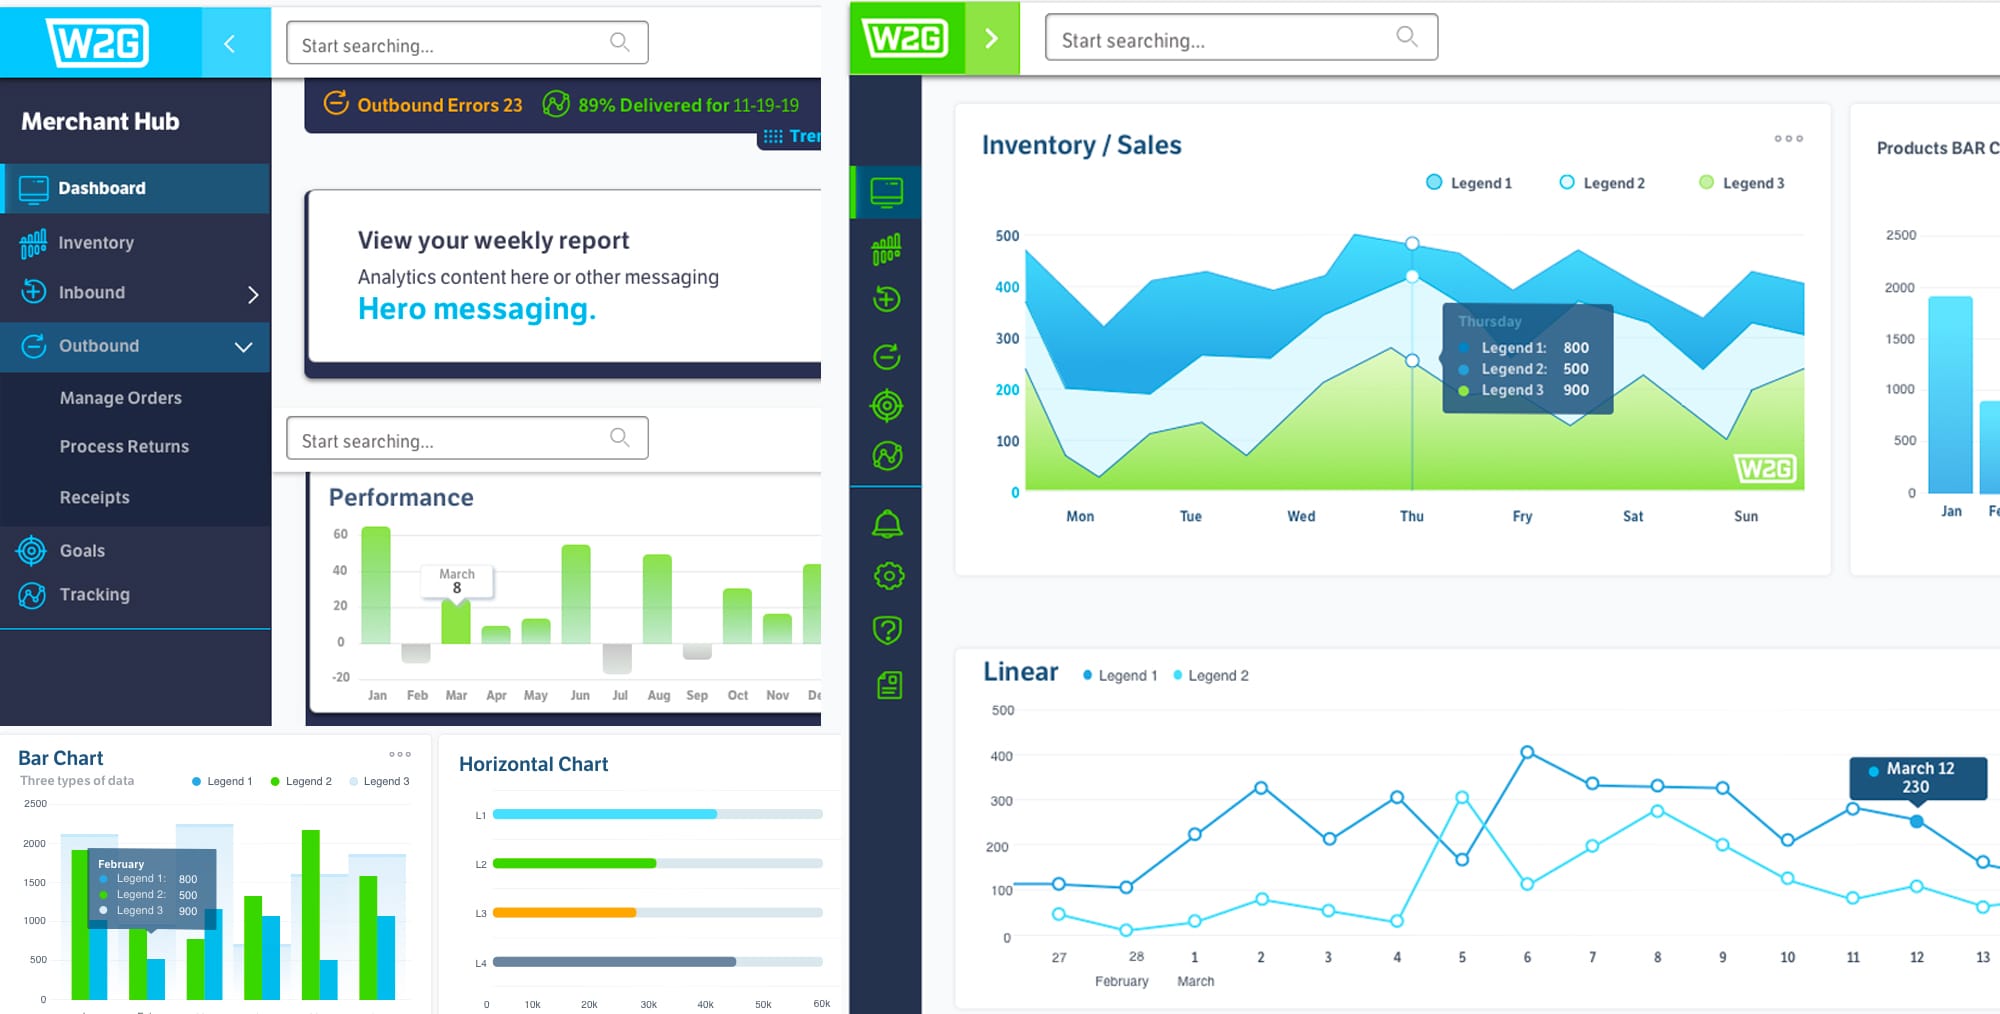
As suppliers entered produce data across multiple regions, the business faced two recurring challenges: incomplete or inaccurate submissions and a lack of visibility into where issues originated. While forms improved the capture of raw inputs, leadership still lacked a clear way to see performance across the ecosystem, whether it was day-to-day operations, supplier reliability, or overall business outcomes. Impact Solution: Tiered Dashboards Aligned to Business Needs | Operational Dashboards Purpose-built for frontline staff, these dashboards provided real-time visibility into form completion rates, shipment updates, and error alerts. Instead of chasing missing data, warehouse teams could spot bottlenecks instantly and resolve them before shipments stalled. Analytical Dashboards Strategic Dashboards |
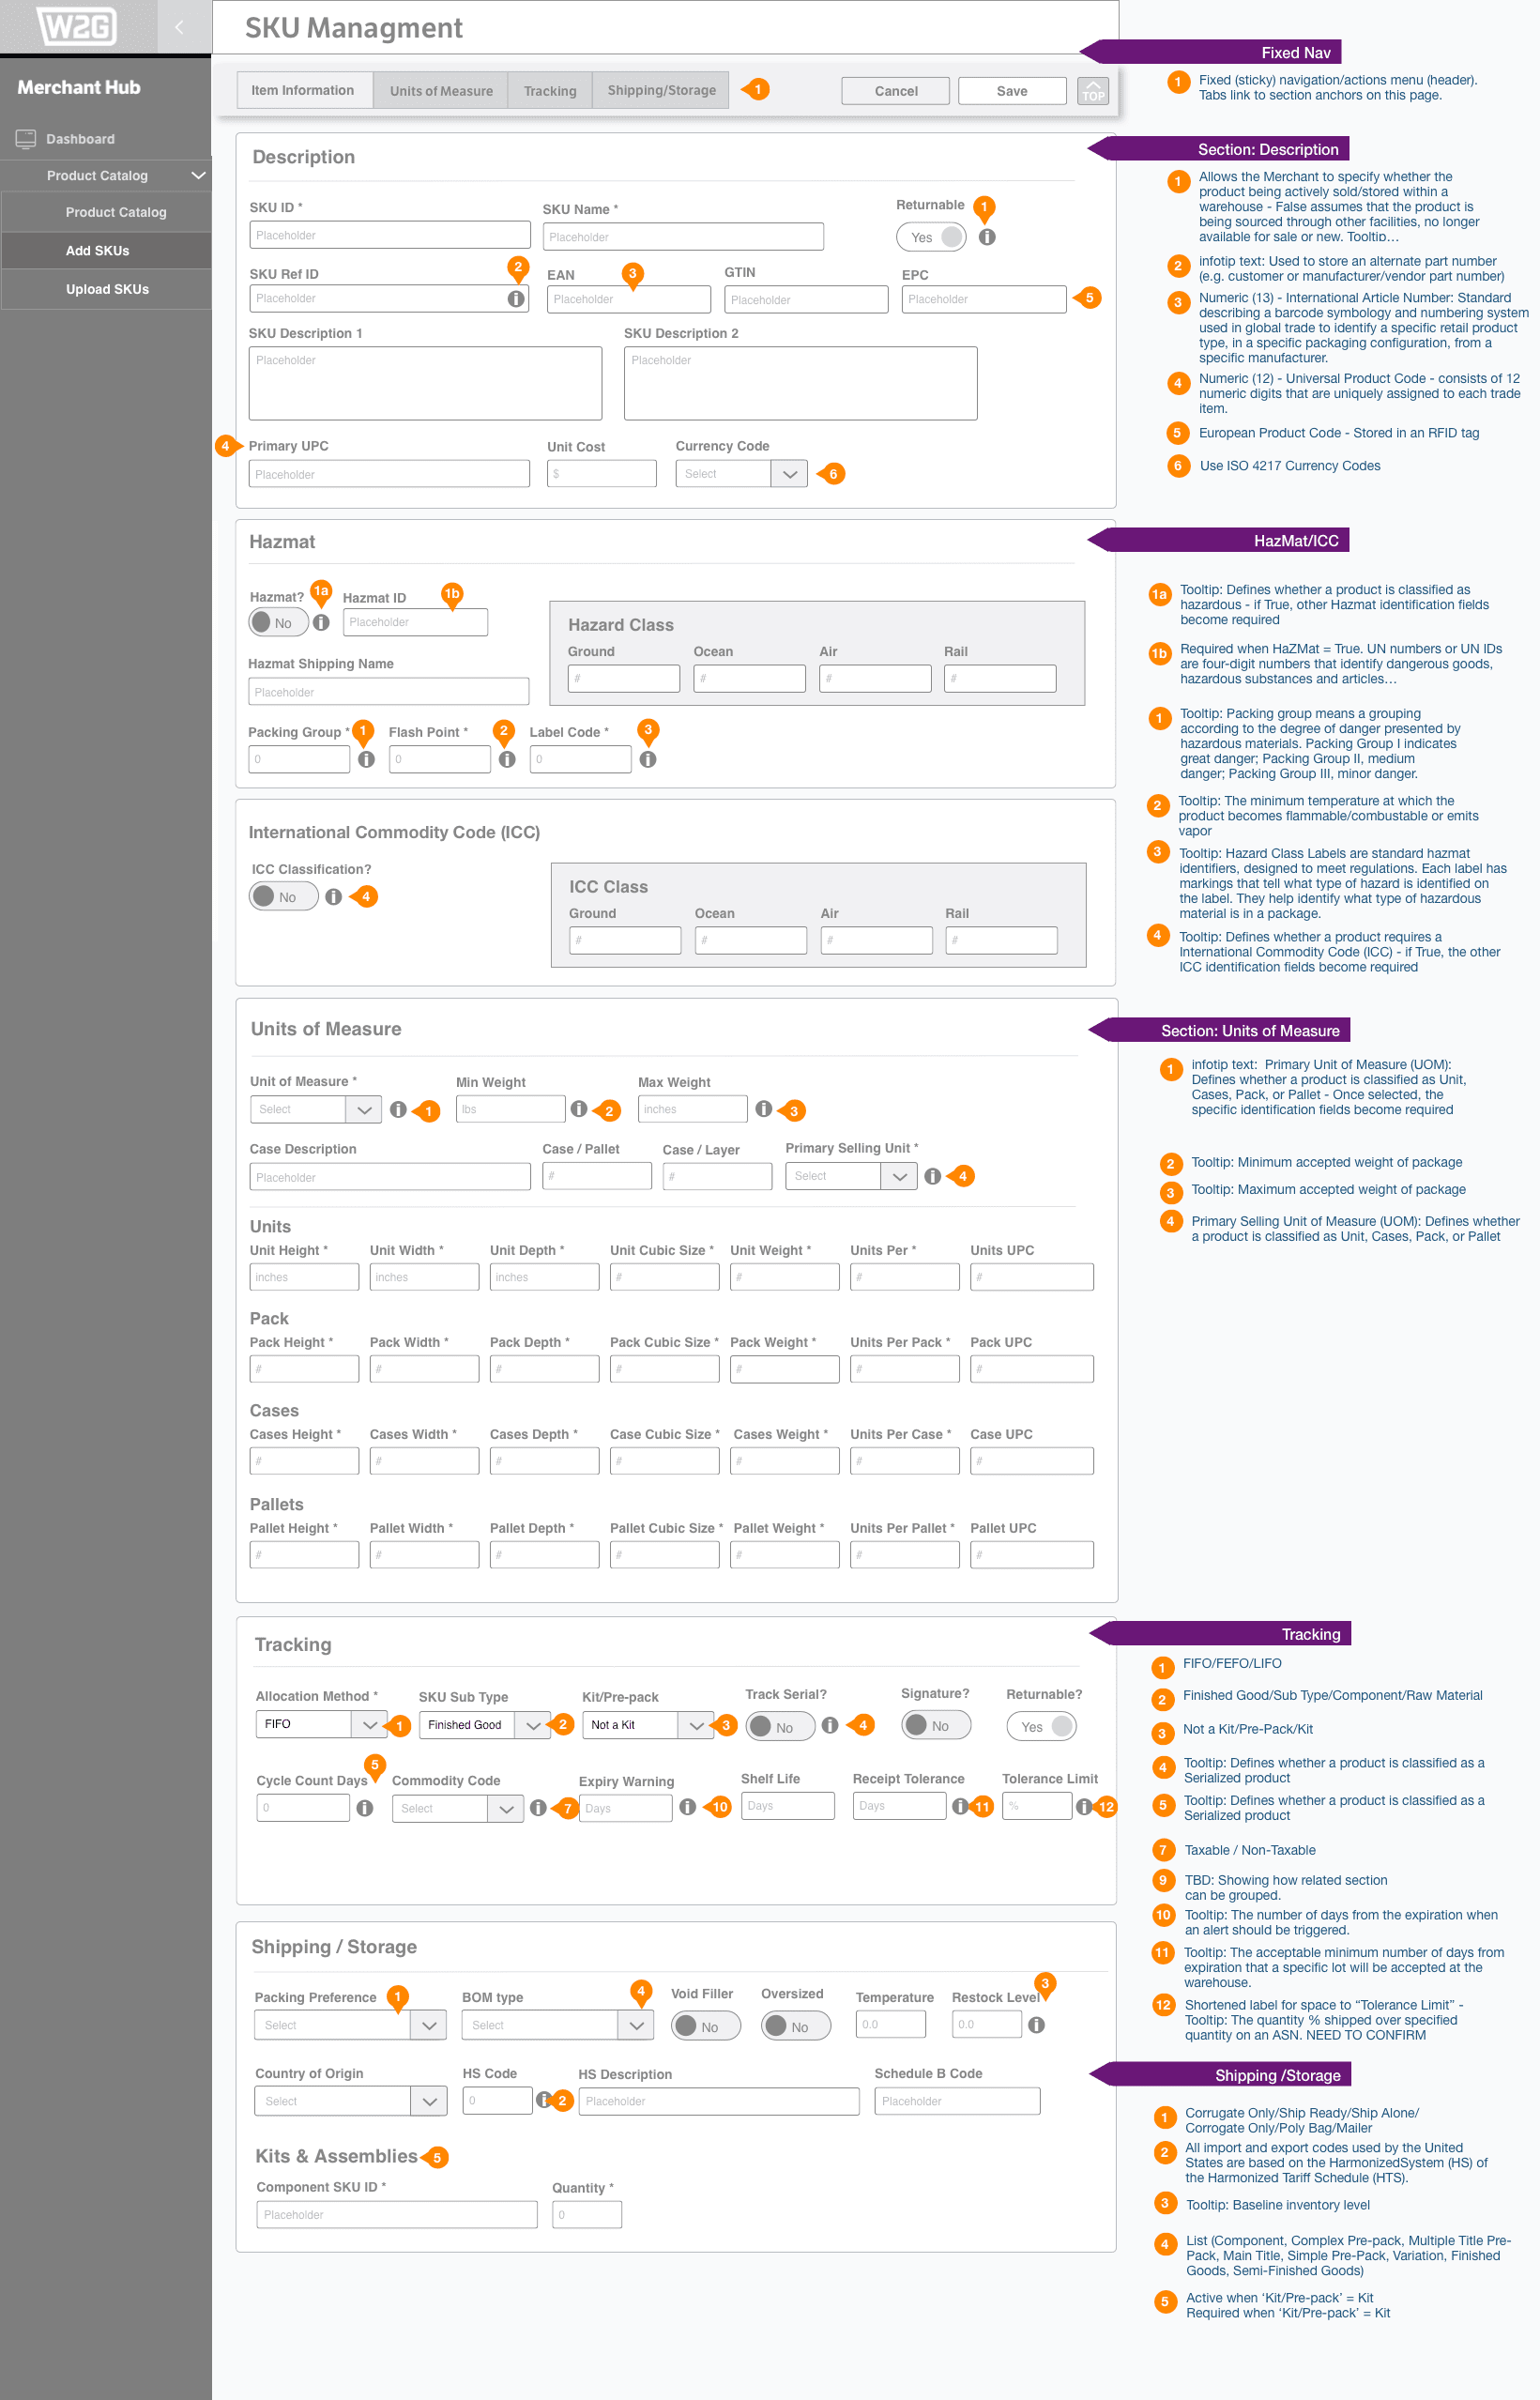
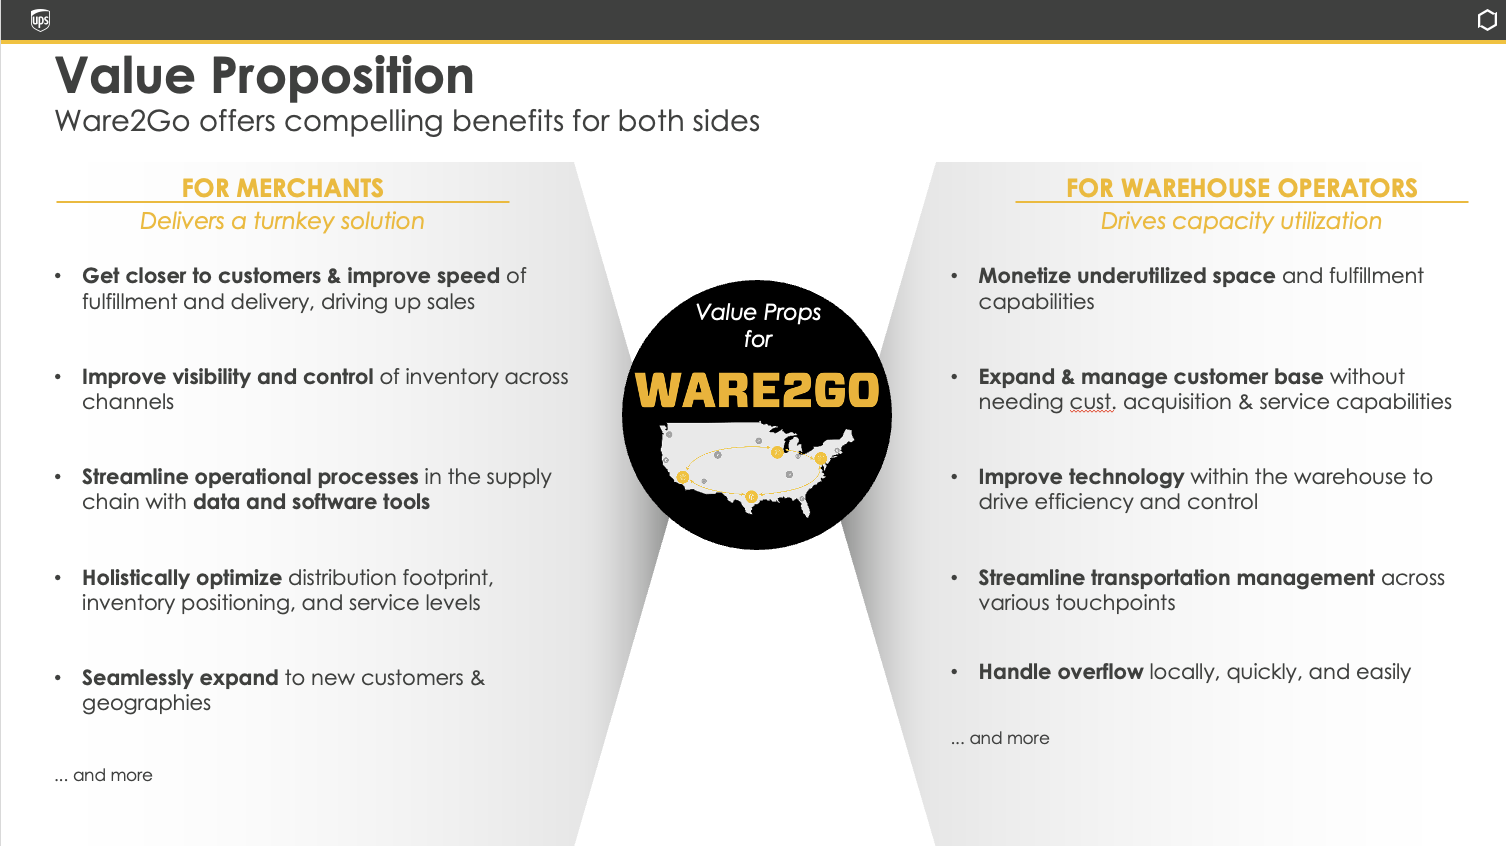
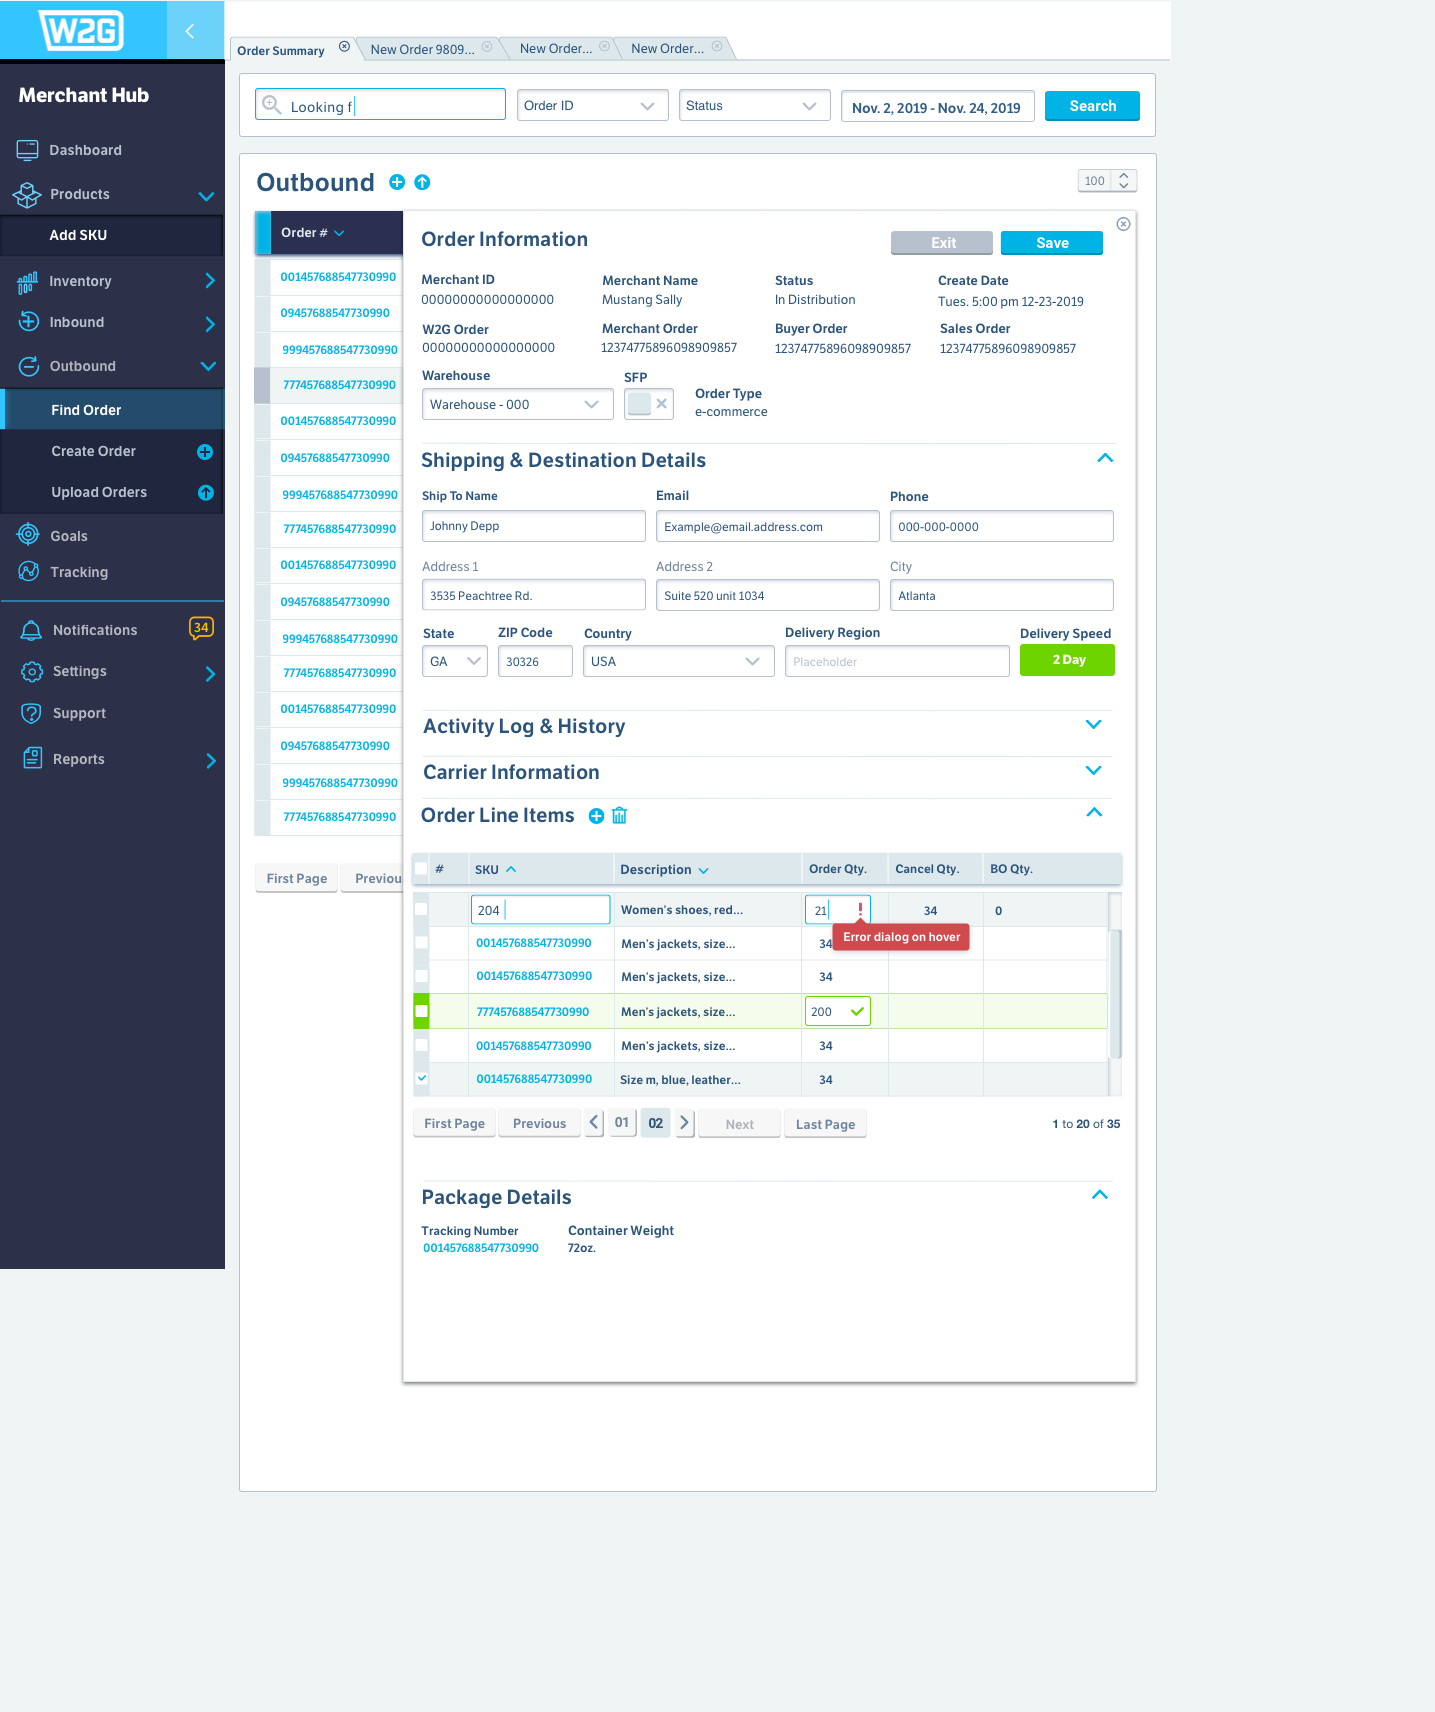
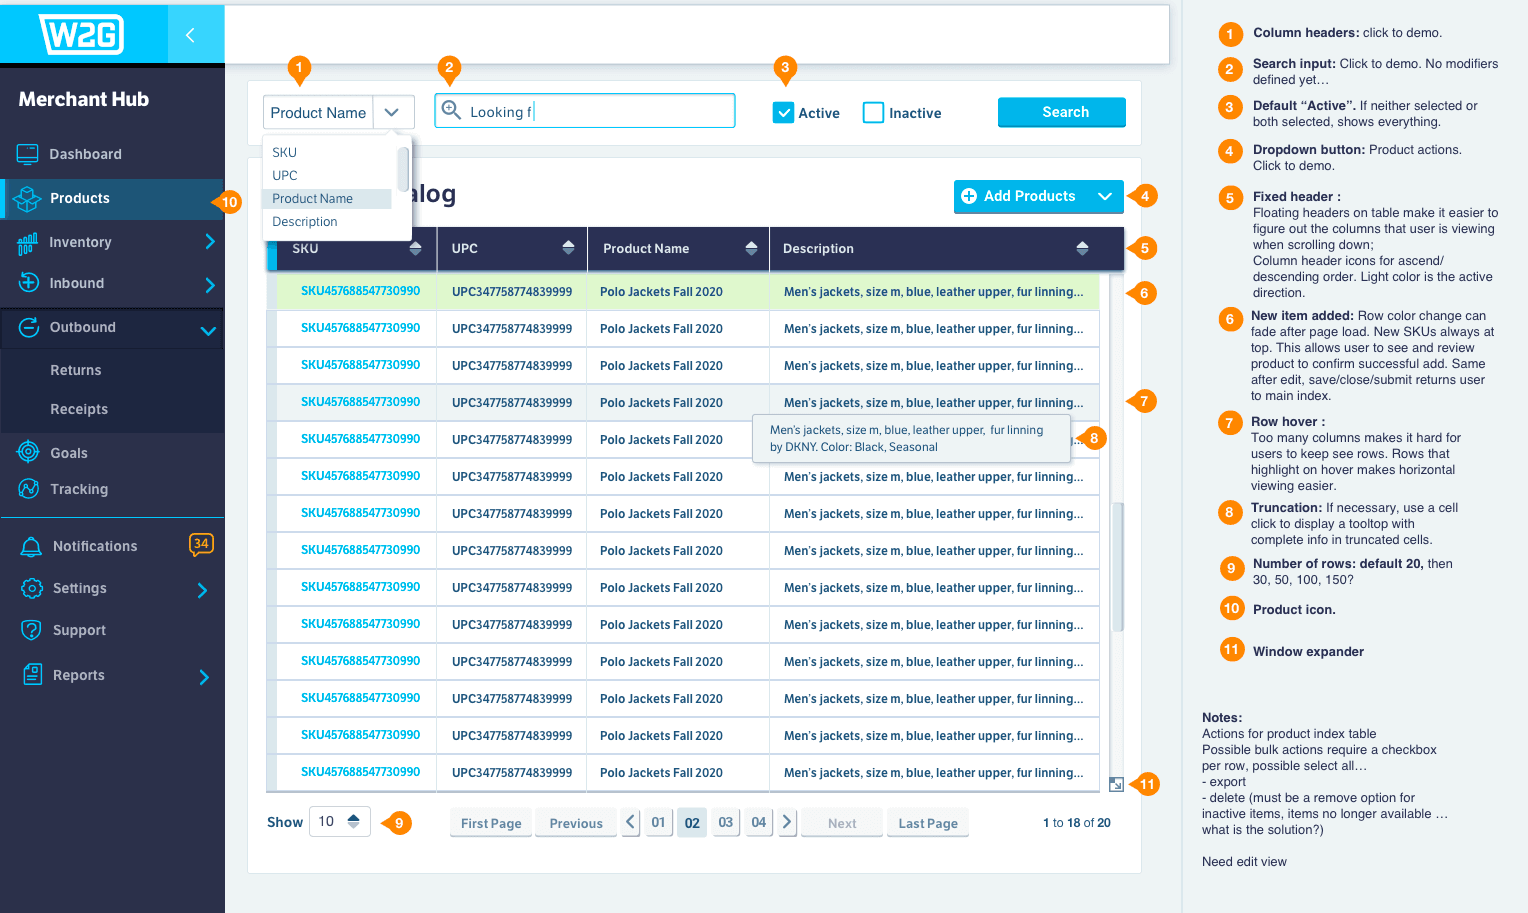
Improve visibility and control of inventory across channels | This is probably the first time I used horizontal tabs across the top to represent the work orders. This pattern follows familiar UI for browsers and tabbing content. It’s the most effective way to organize work with multiple items open – and it’s familiar to all users. I find that repurposing familiar UI patterns greatly reduces multi-tasking anxiety by providing easy visual comparison and quick access to all open work. |
Outcomes
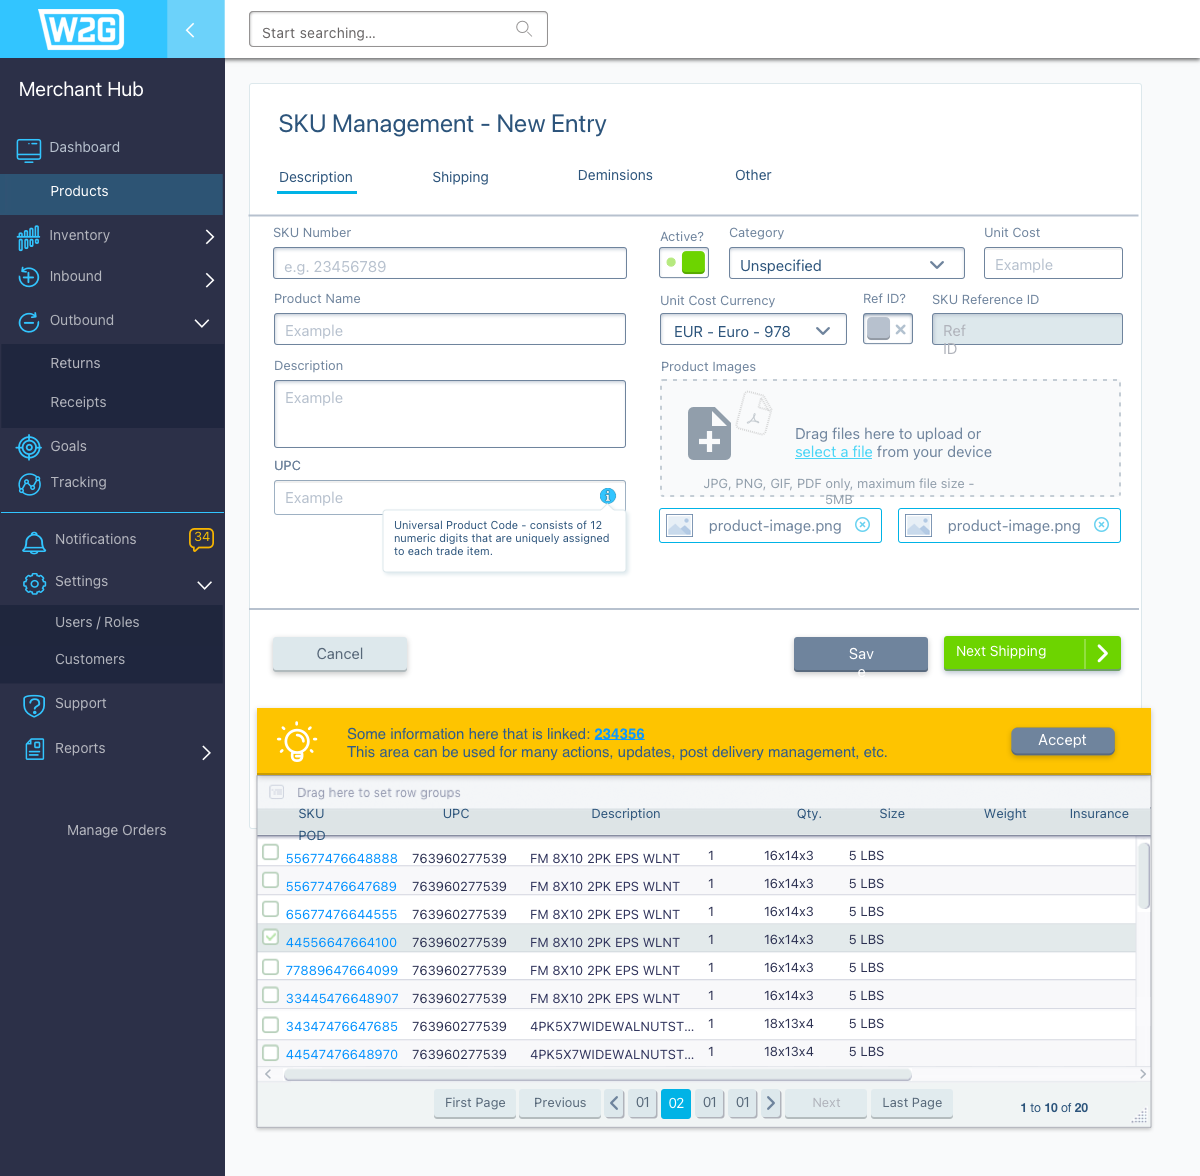
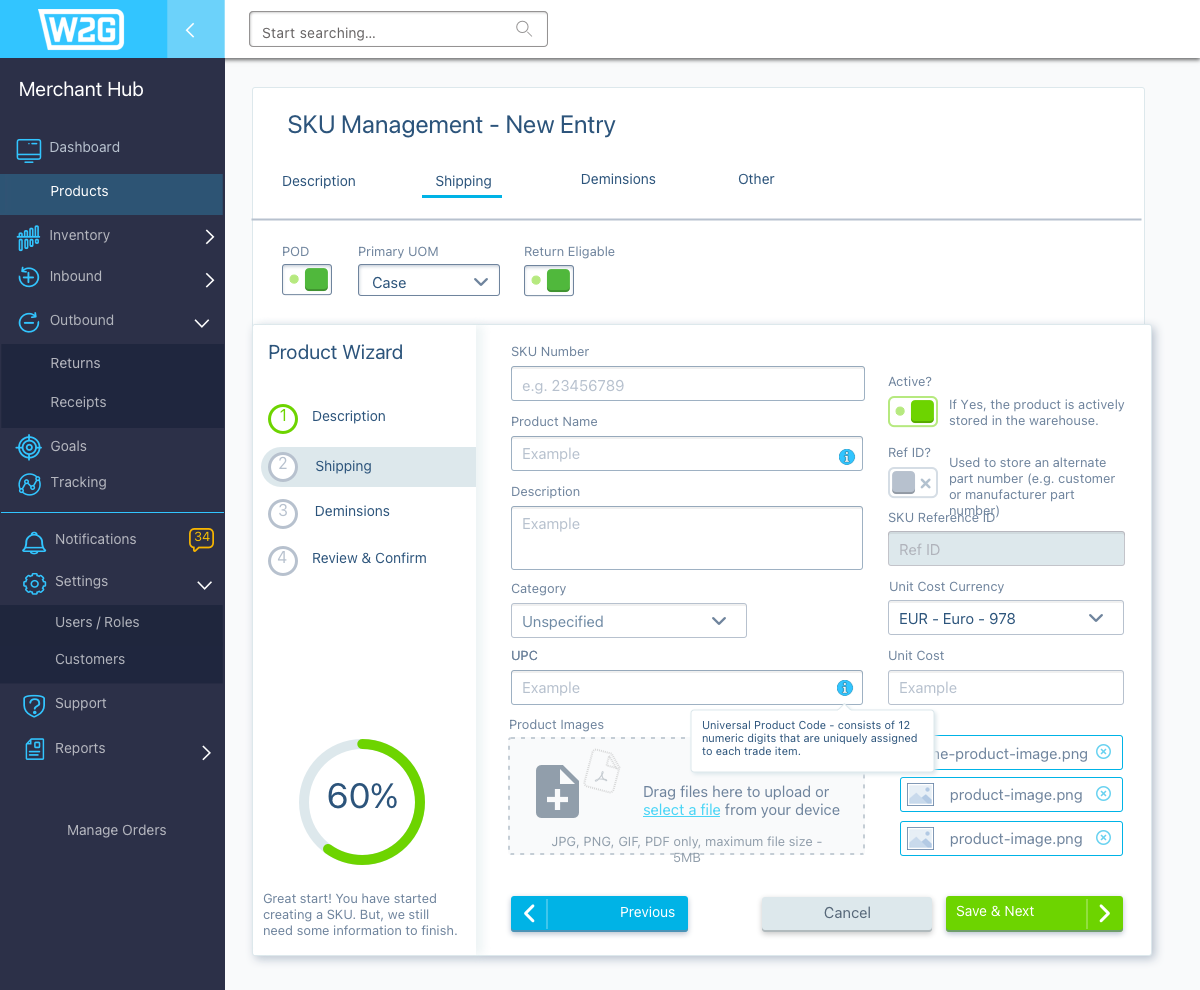
Faster Data Entry: Average task completion time dropped from 2m 45s to 1m 40s (≈39% faster) after redesigning the produce tracking forms with clearer labeling, validation rules, and tabbed navigation. Error Reduction: Form validation and contextual input checks reduced entry errors by 45%, cutting down on costly corrections downstream. Improved Task Success: In usability testing with 8 warehouse operators, task success rates improved from 70% to 95%, with fewer interruptions to ask for help. | Operator Confidence: Post-test surveys showed +30% improvement in self-reported confidence, especially for new hires onboarding to the system. Business Efficiency: Reduced rework time saved an estimated 12 hours per operator per month, contributing to significant operational savings across the enterprise client base. |

 |  |
Holistically optimize distribution footprint, inventory positioning, and service levels
Wireframes and Mockups

UI pattern libraries for this project