I recently spent months in discovery identifying the most meaningful AI prompt evaluation metrics for our work. There are lots of numbers to crunch, but which ones really matter at the uppermost levels of oversight, and where can we find detailed indicators for next steps in the AI lifecycle management system. Adoption was paramount and ease of use for complex tasking was essential for adoption. Relying on AI guidance was helpful for lists of metrics but proved insufficient in prioritizing them based on real usefulness – often completely missing the point of the number; as we know, AI struggles with user-centric thinking. It often suggested metrics that had value but for different reasons: numbers that justify themselves simply by existing.
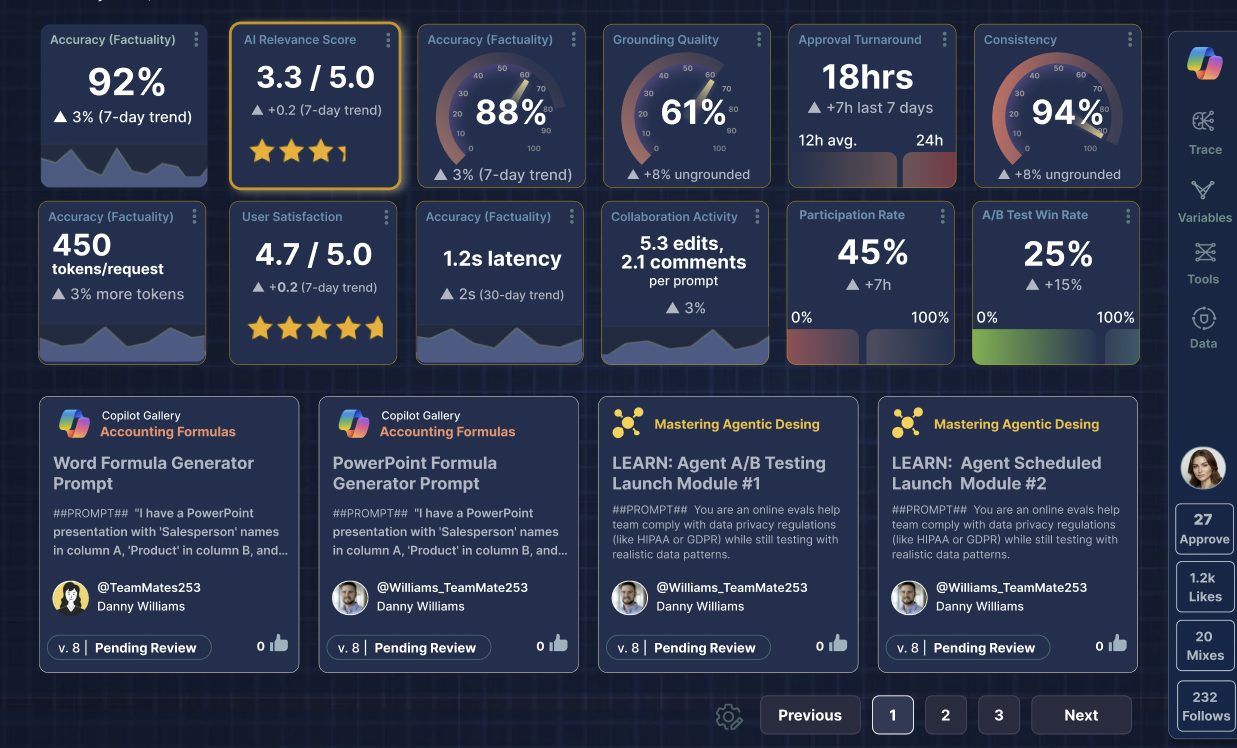
Many practitioners dismiss these analytics as “vanity metrics” data points that look impressive but offer no actionable insights for decision-making, next steps or strategic planning. For administrators overseeing a collaborative prompt management system, where users submit, review, collaborate and iterate on prompts, tracking performance, quality outputs and operational adoption is critical. The enterprises often spend millions implementing this new tool, in hopes of big returns, but that is reliant on adoption and actual usage. Below are 12 essential metrics, ranked from most to least important, to ensure governance, reliability, and continuous improvement in prompt quality.
Accuracy (Factuality) – Measures how factually correct the model’s output is compared to ground truth or verified sources. This is the cornerstone metric for production-grade prompts, especially in domains like healthcare, finance, or legal support. Evaluated using: Human review, LLM-as-judge, or comparison with reference datasets – critical for compliance and trust.
Relevance, accuracy, prompt engineering – Assesses whether the generated response aligns with the user’s intent and stays on-topic. High relevance ensures the prompt guides the model effectively toward desired outcomes. Measured via semantic similarity (e.g., BERTScore, cosine similarity of embeddings); often paired with human scoring rubrics.
Grounding Quality, measuring prompt relevance in AI – Evaluates how well the prompt leverages and cites correct data from connected knowledge sources (e.g., Salesforce objects, vector databases). Poor grounding leads to hallucinations. Key in RAG (Retrieval-Augmented Generation) systems; tracked via citation accuracy and source fidelity.
User Satisfaction Score (USS), RAG, grounding in prompts – Collects direct feedback from end-users interacting with AI outputs (e.g., thumbs up/down, star ratings, surveys). Reflects real-world usability and perceived value; enables closed-loop improvement cycles.
Consistency, user satisfaction in AI prompts – Measures output stability when the same prompt is run multiple times or across different environments. High variance indicates poor prompt design or model sensitivity; evaluated via output similarity metrics over repeated trials.
Approval Turnaround Time, Prompt consistency testing – Tracks the average time taken for a submitted prompt to move from draft → review → approval. Indicates workflow efficiency and team responsiveness; helps identify bottlenecks in governance processes.
Revision Count per Prompt, Prompt approval workflow dashboard – Counts how many iterations a prompt undergoes before approval. High revision counts may signal unclear guidelines or poor initial drafting; useful for training and improving prompt engineering skills.
Prompt iteration best practices Latency & Token Usage – Monitors computational cost and response speed per prompt. Includes input/output token count and end-to-end latency; essential for budgeting and scaling AI features.
Evaluation Pass Rate, monitoring LLM cost and latency – Percentage of prompts that pass automated or manual evaluation criteria on first submission. Low pass rates suggest gaps in training or tooling; can be broken down by team, domain, or prompt type.
A/B Test Win Rate, prompt evaluation pass rate benchmarks – Tracks how often a new prompt version outperforms the current baseline in live or staged testing. Measures real impact on KPIs like conversion, resolution rate, or engagement; drives data-driven decision-making.
A/B testing, prompt engineering Collaboration Activity (Edits, Comments, Contributors) – Logs user engagement within the prompt portal, number of editors, comments, and reviewers per prompt. Indicates health of cross-functional collaboration; helps recognize top contributors and identify inactive workflows.
Rollback Frequency Counts how often a deployed prompt is reverted due to poor performance or errors. High rollback rates signal weak pre-deployment testing or insufficient evaluation; a lagging indicator of overall prompt governance maturity.